FIXED_CYCLES and FIXED_INSTRUCTIONS and sampling speed

When using Instruments to capture FIXED_CYCLES and FIXED_INSTRUCTIONS on both an M1 based MacBook and also on an iPhone, the value of these counts is much higher when enabling High Frequency Sampling.

Why is the count of Instructions and Cycles higher with Higher Frequency Sampling? Is it due to stack sampling overheads?

Which is more accurate to capture FIXED_CYCLES and FIXED_INSTRUCTIONS counts - with High Frequency Sampling or without?

Replies

Hi GurjB,

Sampling overheads could be an explanation. Are you able to share a screenshot of the recording options for the Counters instrument and maybe a screenshot of the recorded data, so we can get a better understanding of what you are seeing and can judge whether it is expected or not? How big is is difference you are seeing?

OK, here is a real example, based on Instruments 14.3 running on an M1 Macbook Pro with MacOS 13.3.1

  1. Open Instruments on Macbook and select CPU Counters only for profiling
  2. Select Recording Options -> Sample By: Time
  3. Add events for Instructions and Cycles only
  4. Select Deferred Recording Mode in Global Options

Open the Clock App (noting the moving second hand - i.e. App is active)

  1. In Instruments select the clock app as the target process to monitor

Click record for 10s+

  1. In Instruments select exactly a 10s region (to show counter values for this exact 10s period of the clock app)

This capture is 1ms Sampling based capture.

  1. In Recording Options -> select High Frequency Sampling

Click record for 10s+

  1. In Instruments select exactly a 10s region (to show counter values for this exact 10s period of the clock app)

This capture is based on 100us Sampling based capture.

Instruments reports the following on my M1 Macbook:

Without High Frequency Sampling

Clock App - Samples = 127, Total Instructions ~= 4M, Total Cycles ~= 23.6M

With High Frequency Sampling

Clock App - Samples = 940, Total Instructions ~= 33.5M, Total Cycles ~= 122.7M

As you can see there is a huge delta between the numbers with the same app running and only difference is the sampling speed setting.

Can you help me to understand why there is a big difference and if there is an accurate way to capture the actual number of Instructions and Cycles being used by an App (in this case Clock app as an example)?

Just to add, that not being able to trust the Instruction counts in particular is concerning. I hope the Instruments authors are able to provide some insight.

I completely agree, you should be able to trust the data that Instruments shows you. However, depending on the technology employed there are some inherent measurement inaccuracies to be aware of. I think you might be running into one here, and if so there could be ways Instruments can do a better job to guard against these or post-process the captured data.

So first of all, could you please file a feedback wit the information you gathered so far? This will make it easier for us to keep track of it and also enables us notify you if there are any changes to Instruments in future versions that improve this behavior.

Secondly, here is our current theory of what's going on:

This maybe related to the overall very low CPU usage of the profiled application (Clock.app in your example). It seems Instruments currently attributes the overhead incurred from sampling to whatever process is on CPU during this time. Basically, if the Clock app only needs 100 cycles to do its work for the few times it's actually on CPU during the sampling, but every time it gets sampled this takes another 1000 cycles to record the data and Instruments attributes that overhead to the Clock.app then the overhead from sampling would dwarf the actual work and still be attributed to the Clock.app process. In a way, from the systems' perspective, the Clock.app is actually doing more work now than before.

This could explain what you are seeing.

However, If you have high CPU usage, the absolute overhead would still be roughly the same but would be much less relative to the work done by the process and thus skew the results much less.

If you can try the same setup with a high-CPU-usage process (at least use one CPU 100% of the measured time frame, even better if you can use all CPU cores 100% of the time during the measured time frame) you should see the a much smaller difference. If you have the chance to try this it would be great to see the results from that and also attach them to the feedback.

So in practice, where it matters (i.e. when the CPU is actually used a lot), I would still expect Instruments to give you accurate results. But I agree that this is an unexpected and confusing result and there might be ways Instruments can prevent this from happening, which is why I asked you to file a feedback in any case.

Thanks for looking into this. If I understand correctly there is some ambiguity over what is going on here and you are making an educated guess on what is happening. It does sound likely that stack sampling activities are contributing to the measured instruction and cycle counts.

It would be great if when selecting HW Counters option rather than Time Profiling option, that stack sampling was disabled. Capturing HW Counter (PMU) data is very light-weight and does not need to be done often.

As requested I have re-run some captures for a heavier application with both low and high frequency sampling. This time I captured on an iPad. I selected Safari Browser and loaded the Speedometer 2.1 benchmark in it as a repeatable test.

Here is a screenshot in low frequency sampling mode (other settings as per above post - i.e. 2 x counters CYCL and INSTR + deferred capture).
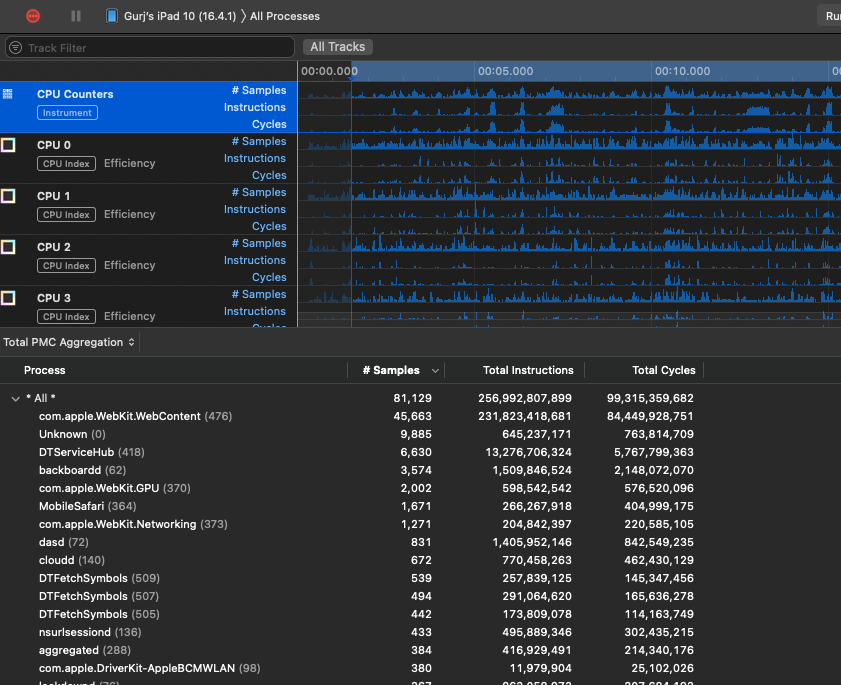
Here is the equiv High Freq sampling screenshot:
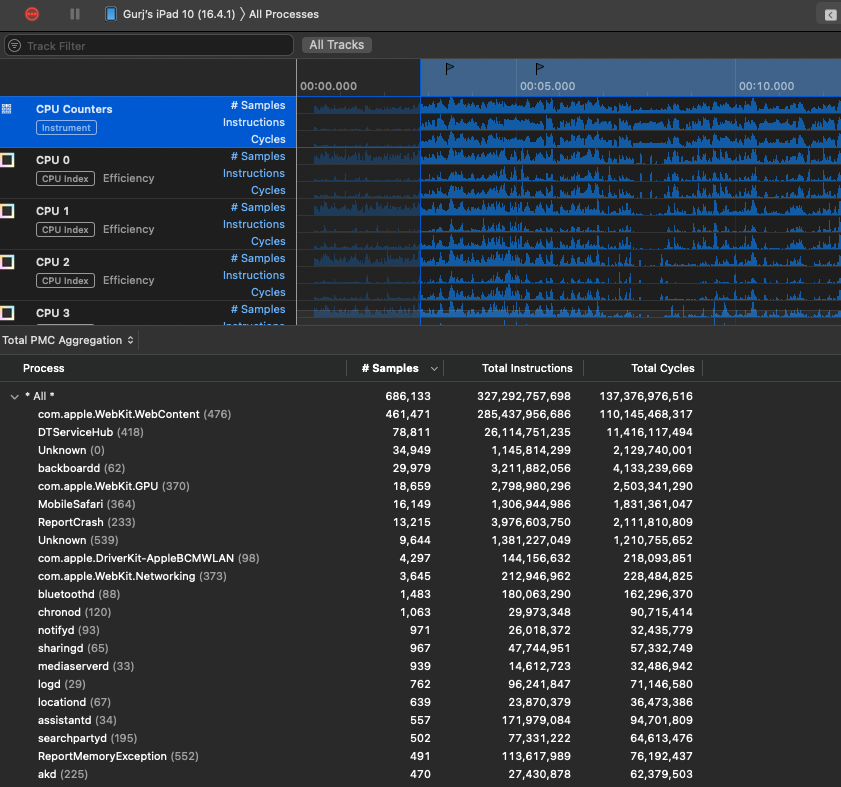
As you can see even though I have captured all processes on the iPad the INSTR and CYCL counts of all processes are very different.

Just for the top process (com.apple.WebKit.WebContent)

Low Freq - INSTR = 232B, CYCL = 84.5B ==> IPC = 2.75

High Freq- INSTR = 285B, CYCL = 110B ==> IPC = 2.59

Looking at all platform activity (to capture indirect work from Safari)

Low Freq - INSTR = 257B, CYCL = 99.3B ==> IPC = 2.59

High Freq- INSTR = 327B, CYCL = 137B ==> IPC = 2.38

Now, since it is clear there is some sort of overhead in the HW Counts here (perhaps due to stack sampling), it's hard to trust either sets of numbers (low or high sampling freq).

Is there any way to disable stack sampling?

If not is there any way to calculate and remove the overhead of stack sampling accurately?