View units, proceeds, sales, and pre-orders
Sales and Trends estimates the USD amount of sales and proceeds on the App Store, based on a rolling average of the previous month's exchange rates.
By default, data is shown in Coordinated Universal Time (UTC). To match the time zone used by downloaded reports, select Pacific Time (PT). A day includes transactions that happened from 12:00 a.m. to 11:59 p.m. for the selected time zone.
Units
By default, the Units section display app units, in-app purchases, and app bundles. You can apply filters to view the number of updates, redownloads, and app units originated from pre-orders.
App and bundle units
The number of first-time purchases of your app or bundle. An app unit or bundle unit is counted when a customer taps the 'Buy' or 'Get' button for the first-time. App updates, downloads from the same Apple ID onto other devices, and redownloads to the same device aren't counted. Family Sharing downloads are included for free apps, but not for paid apps.
In-app purchases
The number of in-app purchases, including consumables, non-consumables, auto-renewable subscriptions, and non-renewable subscriptions. In-app purchases restored by users aren’t counted. Learn about the types of in-app purchase types.
Sales
The total amount billed to customers for purchasing apps, app bundles, and in-app purchases. Sales are inclusive of any applicable taxes we collect and remit per Schedule 2 of the Paid Apps Agreement. Sales for iMessage apps and sticker packs are included in the data for the containing iOS app.
Proceeds
The amount of money you receive on sales of your apps and in-app purchases. This is the Customer Price minus applicable taxes and Apple’s commission, per Schedule 2 of your Paid Apps Agreement. Proceeds in Sales and Trends aren’t final. Learn about final proceeds based on closed transactions.
For paid subscriptions that have been active for less than one year, you receive 70% of the subscription price, minus applicable taxes, or the Rate Before One Year. After a subscriber accumulates one year of paid service, you receive 85% of the subscription price, minus applicable taxes, or the Rate After One Year.
Pre-orders
Before releasing your app on the App Store in a country or region for the first time, you can choose to offer it as a pre-order. People can order your app before it’s released and it’ll automatically download onto their devices on release day. Upon fulfillment to a customer, a pre-order is reflected as an app unit. If a pre-order is a paid app unit, the associated sales from the pre-order also appear upon fulfillment.
Required role: Admin, Finance, or Sales. View role permissions.
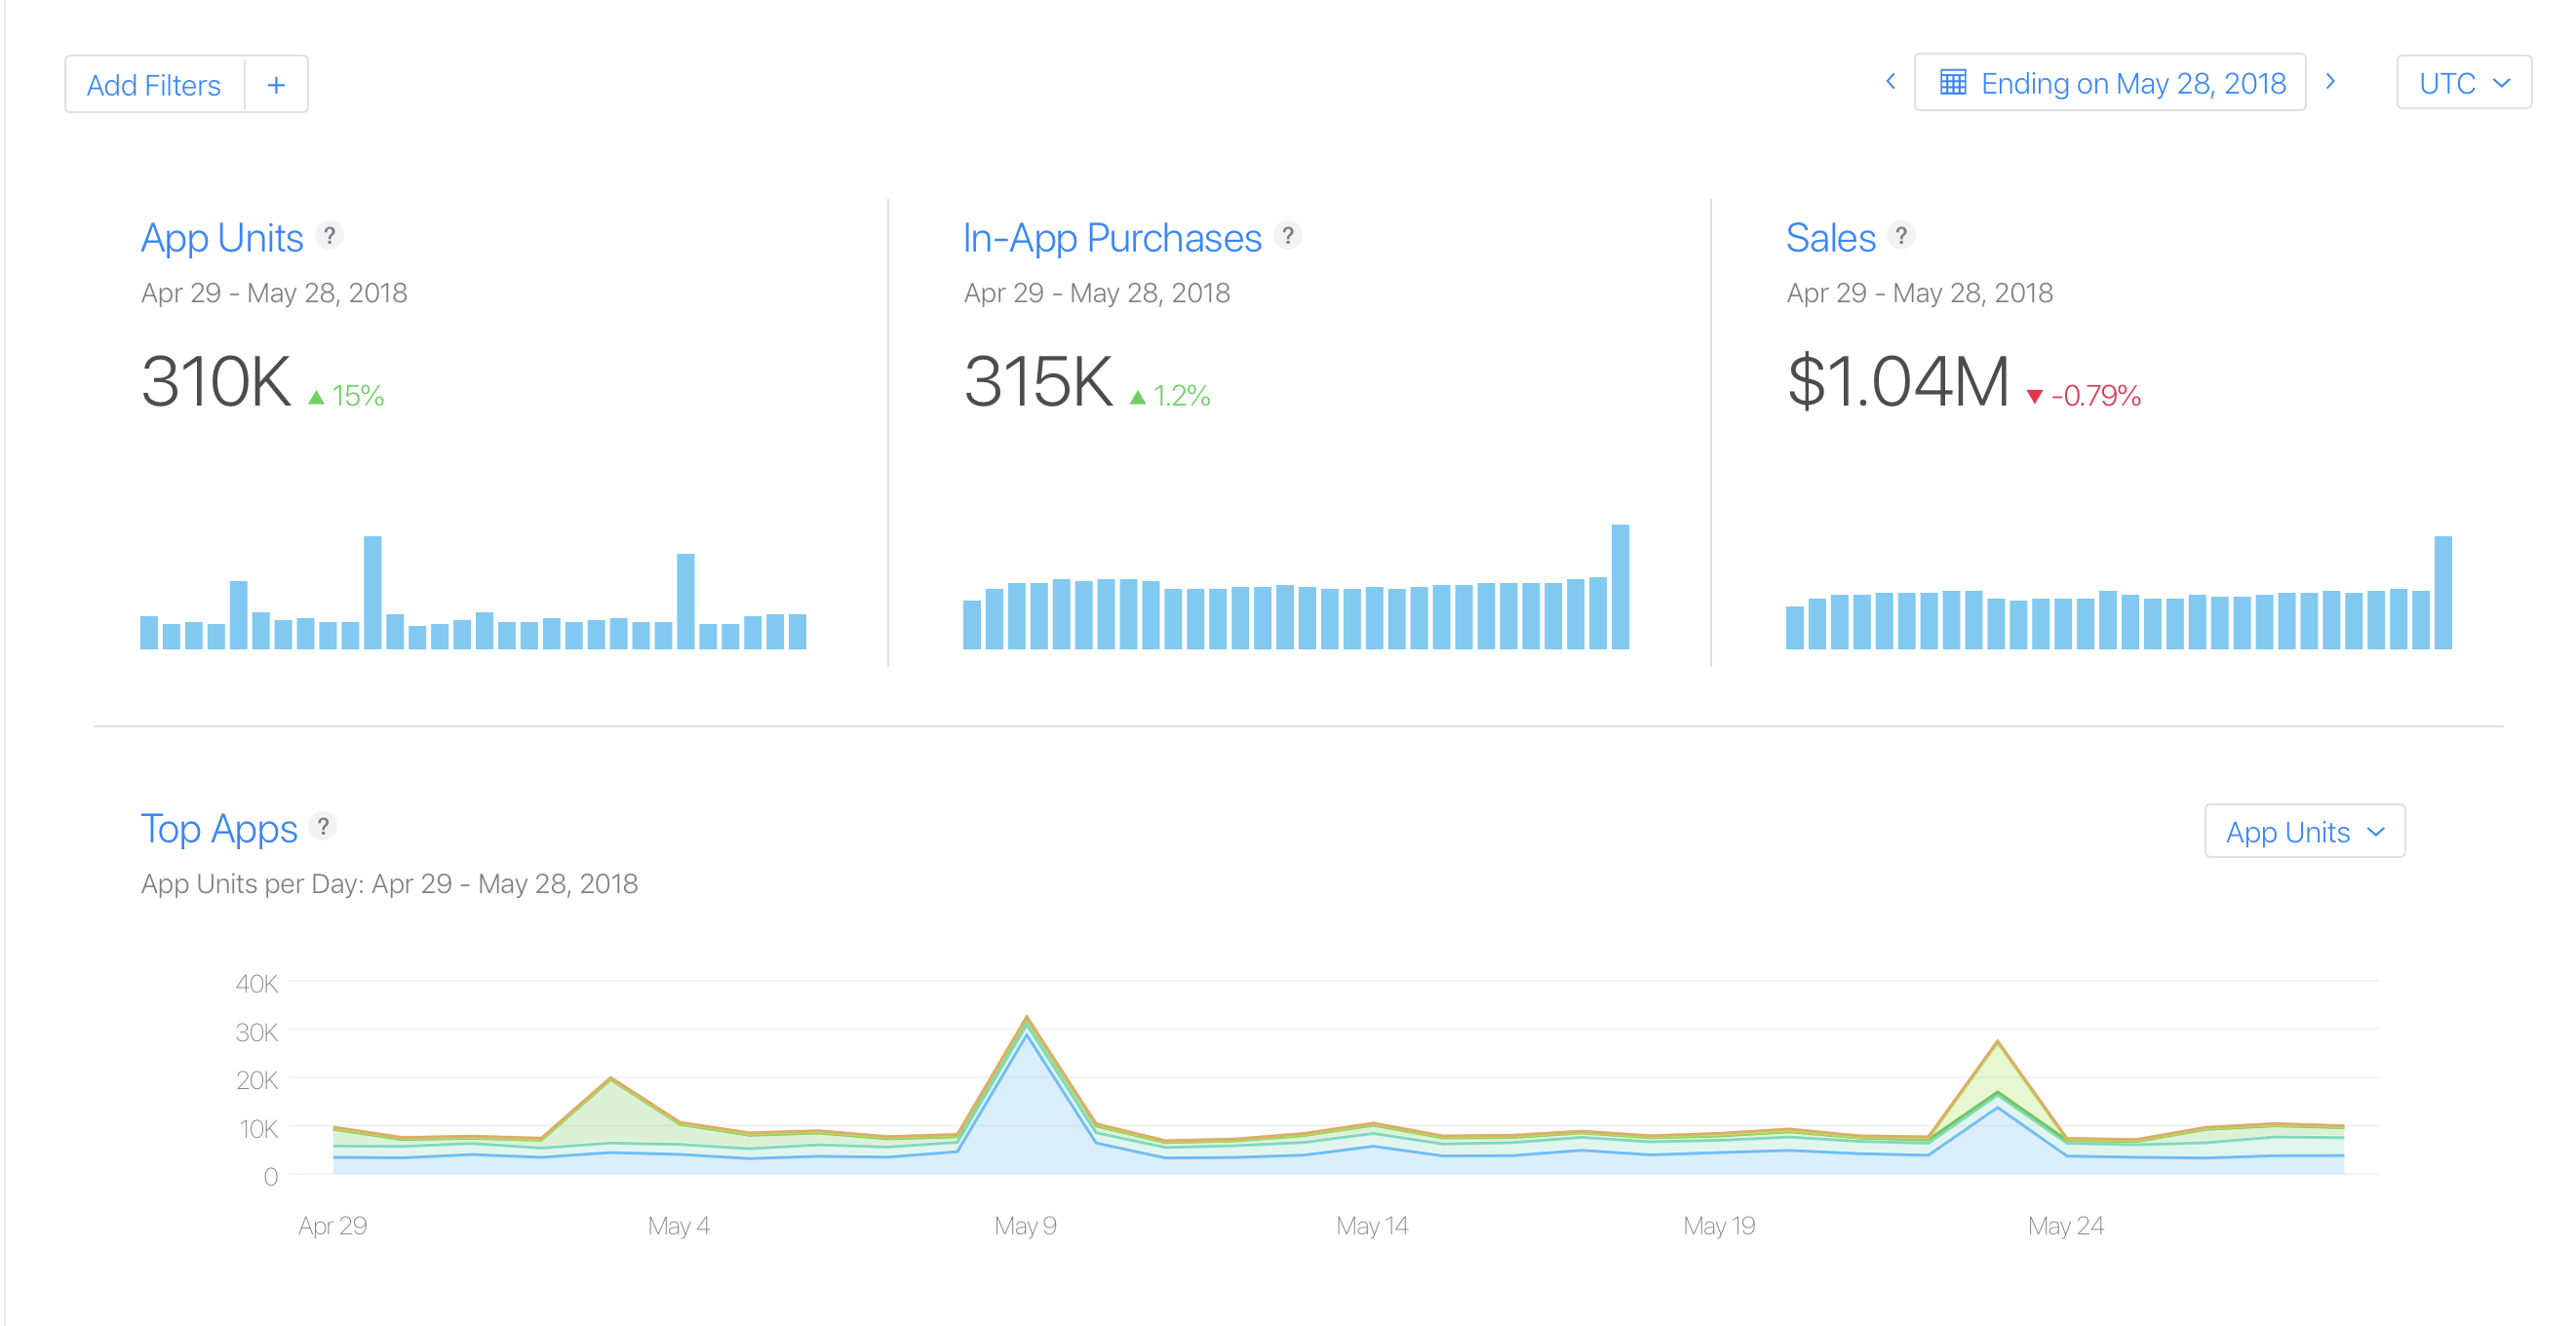
View top apps or in-app purchases
-
From the App Store Connect homepage, click Sales and Trends.
You’ll be taken to an overview of your top apps and in-app purchases.
-
On the top right, choose a date range.
-
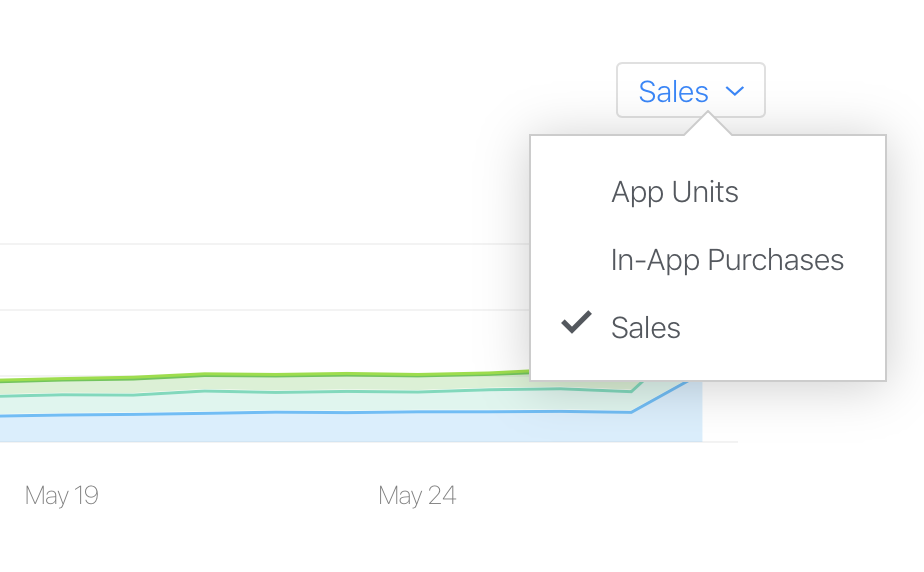
Use the menu to select app units, sales, or in-app purchases.
-
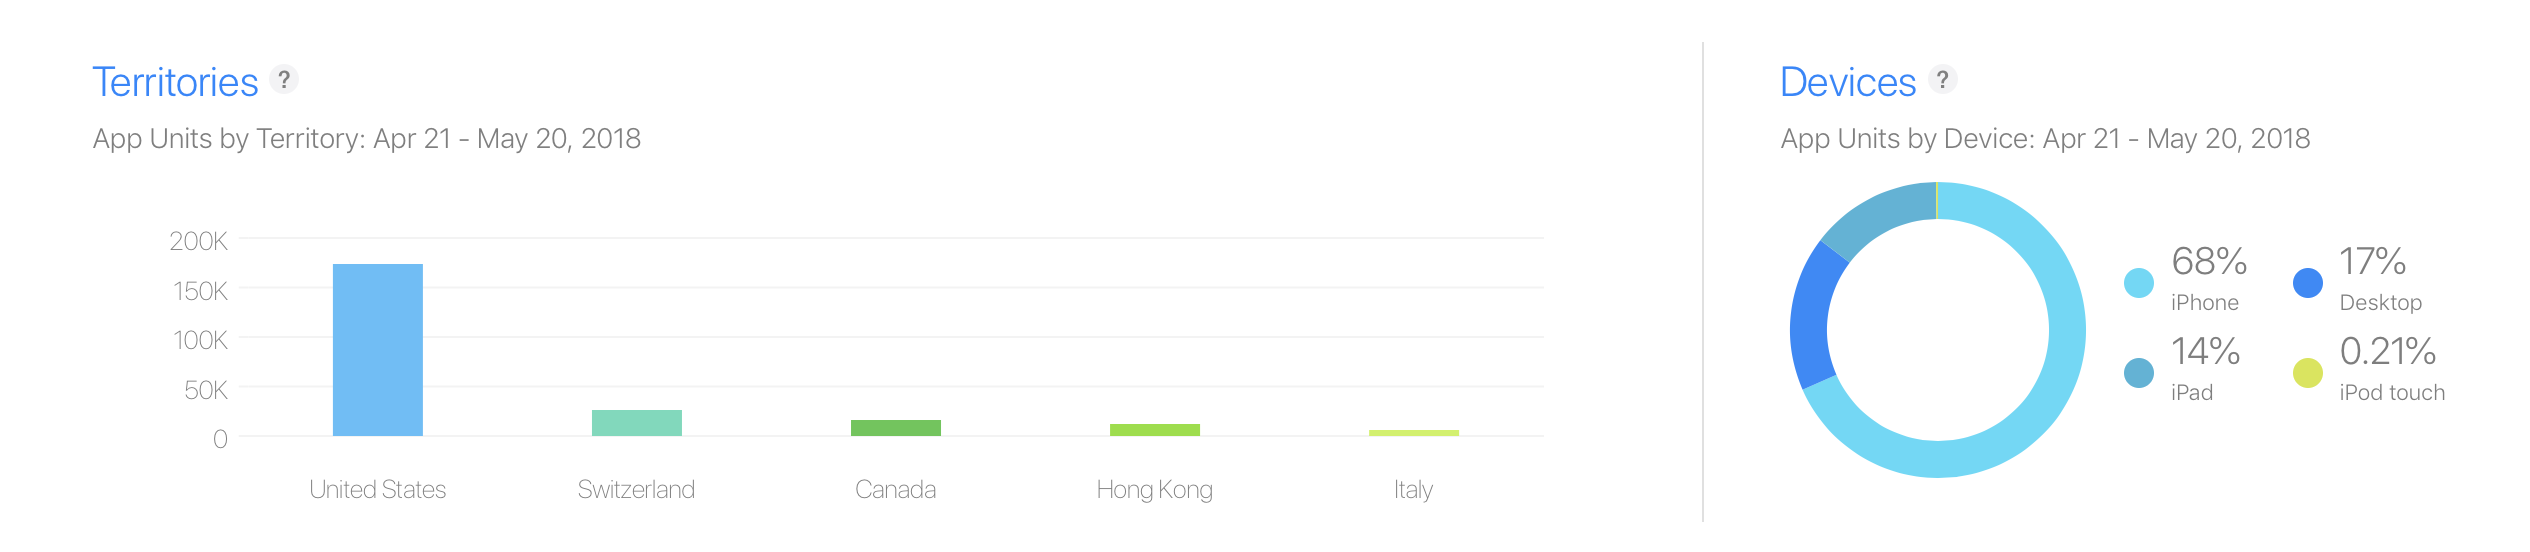
Use the graphs at the bottom to view data by device type and territory.
-
To view what apps and in-app purchases have the most sales, select Sales from the menu.
View units, proceeds, sales, and pre-orders
-
From the App Store Connect homepage, click Sales and Trends.
-
On the left side, click Units, Proceeds, Sales, or Pre-Orders.
By default, the Units metric includes app units, in-purchases, and app bundles. Updates and redownloads are excluded but can be added using a filter.
-
On the top right, click the pop-up menu and choose a time zone.
-
On the top right, choose a date range.
You can view a predefined period (for example, Last 7 Days) or enter a custom range. You can also choose a period using the date slider below the main graph.
-
Click Add Filters, and choose a dimension.
You can create saved views based on the selected dimensions.
-
Click a row in the table below the graph to add the corresponding value to your filters.
For example, if you filter by territory and click the Europe row, the graph and table will display data for territories in Europe.
Create saved views
You can save your current chosen date range, group, and filter selections. You can later choose your saved views from the Sales page menu.
-
From the App Store Connect homepage, click Sales and Trends.
-
On the left side, click Units, Proceeds, Sales, or Pre-Orders.
-
Click Add Filters, and choose a dimension.
-
On the left side, select the add button (+) next to Saved Views.
-
Give the saved view a name and click Save.
-
Return to your saved view at any time by choosing it from the Saved section on the left side.
View refunds
Your daily Unit totals include any processed refunds. However, you can view your total number of refunds in Sales and Trends by adding filters.
-
From the App Store Connect homepage, click Sales and Trends.
-
On the top right, choose a date range.
-
In the upper-left corner, click Add Filters and choose Transaction Type.
-
Under Transaction Type, choose Refunds. Refunds are shown as negative unit values on the right-hand side. Percentage Range shows the change in Refund totals from the previous period for each app or in-app purchase.
View hourly sales data
View hourly sales data
You can view data for your apps and in-app purchases for the last 24-hours. Data is displayed for a rolling period of the previous 24-hour period, and is generally available within two hours.
To view your last 24 hours of sales data:
-
From the App Store Connect homepage, click Sales and Trends.
-
On the left side, click Units, Proceeds, Sales, or Pre-Orders.
-
On the top right, click the date picker and select Last 24 Hours.
-
Filter by content to view data for a specific app or in-app purchase, or by territory to view where your app’s performance is highest.
Why are there sales for in-app purchases in countries or regions in which my app is not available?
While apps are only available for sale in the countries or regions you specify, in-app purchases are available in all countries or regions. This allows customers to continue using apps they own, for example, after they move to a different country or region. Customers can only make in-app purchases if they already own that app.
Why are there more updates than the total downloaded units in Sales and Trends?
Your total downloaded units are based on unique users. Updates are counted on every device on which they’re installed, even when the device shares the same Apple ID. If you release frequent updates of your app, there may be significantly more updates than total downloads.